
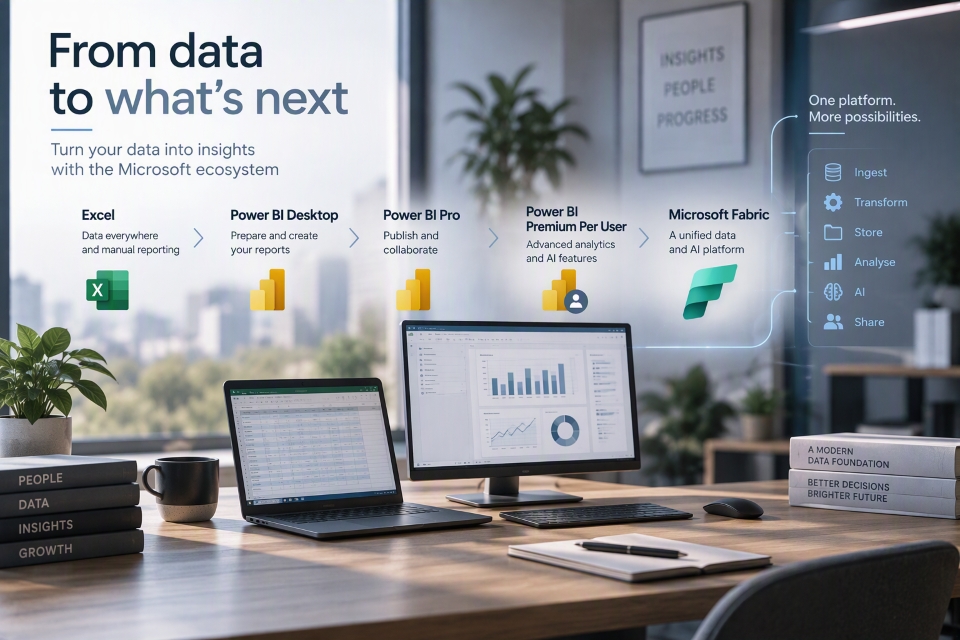
Many business intelligence projects begin with Excel files, several business applications and reports prepared by hand. Every month, teams extract the same data, copy it into different files and rebuild their indicators.
This approach can work initially. As sources and users increase, however, its limits become visible: different versions of the same figure, formulas that are difficult to maintain and too much time spent preparing information rather than analysing it.
Business Intelligence, or BI, connects data sources, applies common preparation rules and presents reliable indicators through interactive reports.
What is Business Intelligence used for?
Consider a sales department whose data is divided between a CRM, a business management system and several Excel files.
Without a BI tool, someone must manually reconcile sales, targets and margins. Power BI can connect these sources, apply consistent transformation rules and create a shared model.
Users can then analyse results by period, branch, product or territory. Excel remains useful for data entry and individual analysis. Power BI becomes relevant when the organisation needs to make its indicators more reliable, reusable and easier to distribute.
Step 1: Power BI Desktop for report creation
Power BI Desktop is a free application for connecting data sources, preparing information with Power Query, building semantic models, creating DAX measures and designing interactive reports.
This stage suits someone working independently or testing an initial use case. The resulting file can be distributed manually, but this method does not provide centralised distribution, online collaboration or structured access management.
Microsoft introduces the application in its Power BI Desktop documentation (opens in a new tab).
Step 2: Power BI Pro for publishing and collaboration
Power BI Pro is the standard licence for collaborative BI. It allows users to publish reports to workspaces, share content and collaborate.
In a standard Power BI Pro environment, authors and readers of shared content need a Power BI Pro licence or a compatible licence.
This model can remain suitable when the data is already organised and the requirement is primarily reporting. Microsoft explains the associated rights in Power BI service features by licence type (opens in a new tab).
Step 3: Premium Per User for advanced requirements
Power BI Premium Per User, or PPU, includes Pro capabilities and adds most Power BI Premium features on an individual basis.
PPU can suit a defined group working with more demanding models. Its main constraint concerns distribution: users who consume content in a PPU workspace normally need an appropriate PPU licence.
PPU remains an individual Power BI licence. It does not provide a Microsoft Fabric capacity that can independently run Lakehouses, Warehouses or notebooks. Microsoft explains this distinction in its documentation on Microsoft Fabric licences and capacities (opens in a new tab).
Intelligent analysis in Power BI
Power BI can identify unusual values, significant changes, trends and correlations. These features help users direct their analysis, but they do not replace business knowledge.
Microsoft describes these capabilities in its documentation on Power BI insights (opens in a new tab).
Copilot in Power BI
Copilot allows users to make selected requests in natural language. Depending on the available experience, it can help explore or summarise a report, explain results, and generate or explain DAX expressions.
The quality of its responses depends on the semantic model. Measures, relationships and business definitions must be clear.
A PPU licence alone does not enable Copilot. Microsoft also requires an eligible paid capacity, a supported region and the appropriate administrative settings. These requirements are explained in the Copilot for Power BI overview (opens in a new tab).
Step 4: Microsoft Fabric for an industrialised data platform
As the number of sources, data volumes and use cases increases, the requirement goes beyond report creation. The organisation must also determine how data is collected, prepared, stored and made available to its teams.
Microsoft Fabric brings these different stages together in a single platform. The objective is to establish a consistent data chain: information is collected from business applications, checked and transformed, and then organised to support analysis and Power BI reporting.
Fabric can support:
- data ingestion and transformation pipelines, which automate the collection of data from files, applications or databases and prepare it for analytical use;
- Lakehouses, which bring files and tables together in one environment so that different types of data can be retained and used by several analytical tools;
- Warehouses, which organise structured data in an environment suited to SQL queries, reporting and performance monitoring;
- notebooks, which allow data teams to write, document and run code, together with Apache Spark processing for transforming large data volumes;
- real-time data and event analysis, which is useful when information must be processed as it arrives, for example to monitor operational activity, application events or data from connected systems;
- semantic models, which translate technical data into business concepts through shared relationships, metrics and calculation rules;
- Power BI reports, which present the results as interactive visualisations for authorised users.
These components are not isolated tools. They represent the different stages of the same journey: collecting data, transforming it, organising it, defining shared metrics and presenting the results to users.
These experiences rely on OneLake, Microsoft Fabric’s unified storage foundation. OneLake provides a common logical location for the platform’s different components, allowing multiple analytical use cases to work with the same data without creating unnecessary independent copies.
Microsoft distinguishes between the Warehouse, which is primarily designed for structured data, SQL queries and reporting, and the Lakehouse, which combines file storage, Delta tables, and processing through Spark or SQL.
For an organisation accustomed to Excel, the practical benefit is clear. Data from the CRM, ERP, files and other applications can be collected and prepared according to common rules, and then reused across semantic models, Power BI reports and other analytical projects.
The organisation is therefore not simply replacing an Excel file with another tool. It is progressively establishing a shared data chain that is easier to maintain, secure and extend.
Microsoft explains the main components in What is Microsoft Fabric? (opens in a new tab) and What is OneLake? (opens in a new tab).
A practical example: the journey of sales data through Fabric
Consider an organisation that monitors sales using three sources: its CRM, ERP and Excel files supplied by regional teams.
A data ingestion and transformation pipeline regularly collects information from these sources. It automates activities that were previously carried out manually, such as importing files, aligning formats and preparing the information required for analysis.
The data can initially be placed in a Lakehouse. This environment can retain information from the different systems, including the original files and prepared tables.
Notebooks and Apache Spark processing can then apply more advanced transformations. For example, the organisation could align product references, correct selected formats or match customers that appear in more than one application.
Once the data has been cleaned and organised, the information required for reporting can feed a Warehouse. Sales, products, customers, territories and targets are structured in a form suited to SQL analysis.
A Power BI semantic model is then built on this data. The model defines the relationships between the information and the shared business metrics, such as revenue, margin, target achievement and sales trends.
Users can finally access these metrics through interactive Power BI reports. Managers can filter the results by period, product, branch or territory without rebuilding a separate file for every analysis.
If the organisation also receives information that must be monitored as it arrives, Fabric can extend the journey with real-time analysis. Historical indicators can then be considered alongside recent operational events.
Throughout this journey, OneLake provides the shared storage foundation. Fabric components operate at different stages but work within a common environment: the pipeline collects the data, the Lakehouse retains it and supports its transformation, the Warehouse organises it, the semantic model gives it business meaning, and Power BI presents it to users.
The organisation can therefore move from reporting that is manually rebuilt across several Excel files to a shared, repeatable data chain that is easier to extend.
What AI adds to Microsoft Fabric
Artificial intelligence in Fabric is not limited to asking questions about a report. It can assist at several stages of the data journey.
Copilot can support selected preparation, development and analytical tasks. It can help teams work with transformations, queries, pipelines or code. Its suggestions must nevertheless be reviewed before they are used in a production environment.
The Data Science experience can also support the development and experimentation of machine-learning models. An organisation could, for example, produce a demand forecast or renewal score and then present the result through Power BI.
A prediction is never a certainty. Its quality depends on the underlying data, the method used, the validation process and ongoing monitoring.
Microsoft describes the prerequisites in its documentation on enabling and configuring Copilot in Microsoft Fabric (opens in a new tab).
Which path should you choose?
- Power BI Desktop to create initial reports;
- Power BI Pro to publish, share and collaborate;
- Power BI Premium Per User for advanced Power BI capabilities;
- Microsoft Fabric to build a data platform and develop AI use cases.
An organisation can remain on Power BI Pro if it meets the requirement. It can also move directly to Fabric when the project requires a data warehouse, pipelines or a shared analytics platform.
MC3 Cloud provides a service:power-bi-business-reporting service covering metric definition, data preparation, report development, refresh configuration, secure sharing, training and maintenance.